
The Coverage Pressure Index: Quantifying Receiver Freedom Using Tracking Data
ABSTRACT
Traditional NFL analytics measure separation as the distance between receiver and defender at the moment the ball is thrown. But separation is a snapshot: a receiver might have three yards of cushion at the throw, but if the defender has the right angle, that space disappears before the ball arrives. The Coverage Pressure Index (CPI) measures the percentage of a receiver’s possible movement options that defenders can also reach. A CPI of 0% means total freedom, 100% means completely smothered. It answers the question separation can’t: how much room does the receiver actually have, and how much can defenders take away?
Key findings
Leverage beats proximity
Defenders five yards away with the right angle generate more constraint than defenders two yards away with poor positioning. On two plays that both looked “open” by separation, one receiver had a CPI of 0% and the other 64.4%.
Receiver position matters more than raw separation
Tight ends face pressure fastest (0.74s on average), while wide receivers face the highest peak pressure: 5.4% average max CPI versus 3.8% for tight ends.
Alignment beats proximity for defenders too
Cornerbacks generate the highest peak pressure (6.4% average max CPI); free safeties take longest to generate pressure (0.83s) and produce the lowest peak constraint (2.5%).
Most coverage builds gradually
On a typical play, CPI starts near 0% and climbs to about 50% by 0.8 seconds as defenders close their angles. This is zone coverage working as designed.
METHODOLOGY IN BRIEF
Using NFL Next Gen Stats tracking data for all 819 targeted-receiver passing plays from Week 1 of the 2023 season, each player’s reachable space is modeled at the throw frame with Monte Carlo simulation: 80 to 200 simulated paths per player at 0.3s, 0.5s, 0.8s, and 1.0s, bounded by position-specific acceleration and a 30-degree directional limit.
The Coverage Pressure Index is the overlap between the receiver’s reachable zone and those of the nearest four to six defenders: the share of the receiver’s movement options that defenders can also reach.
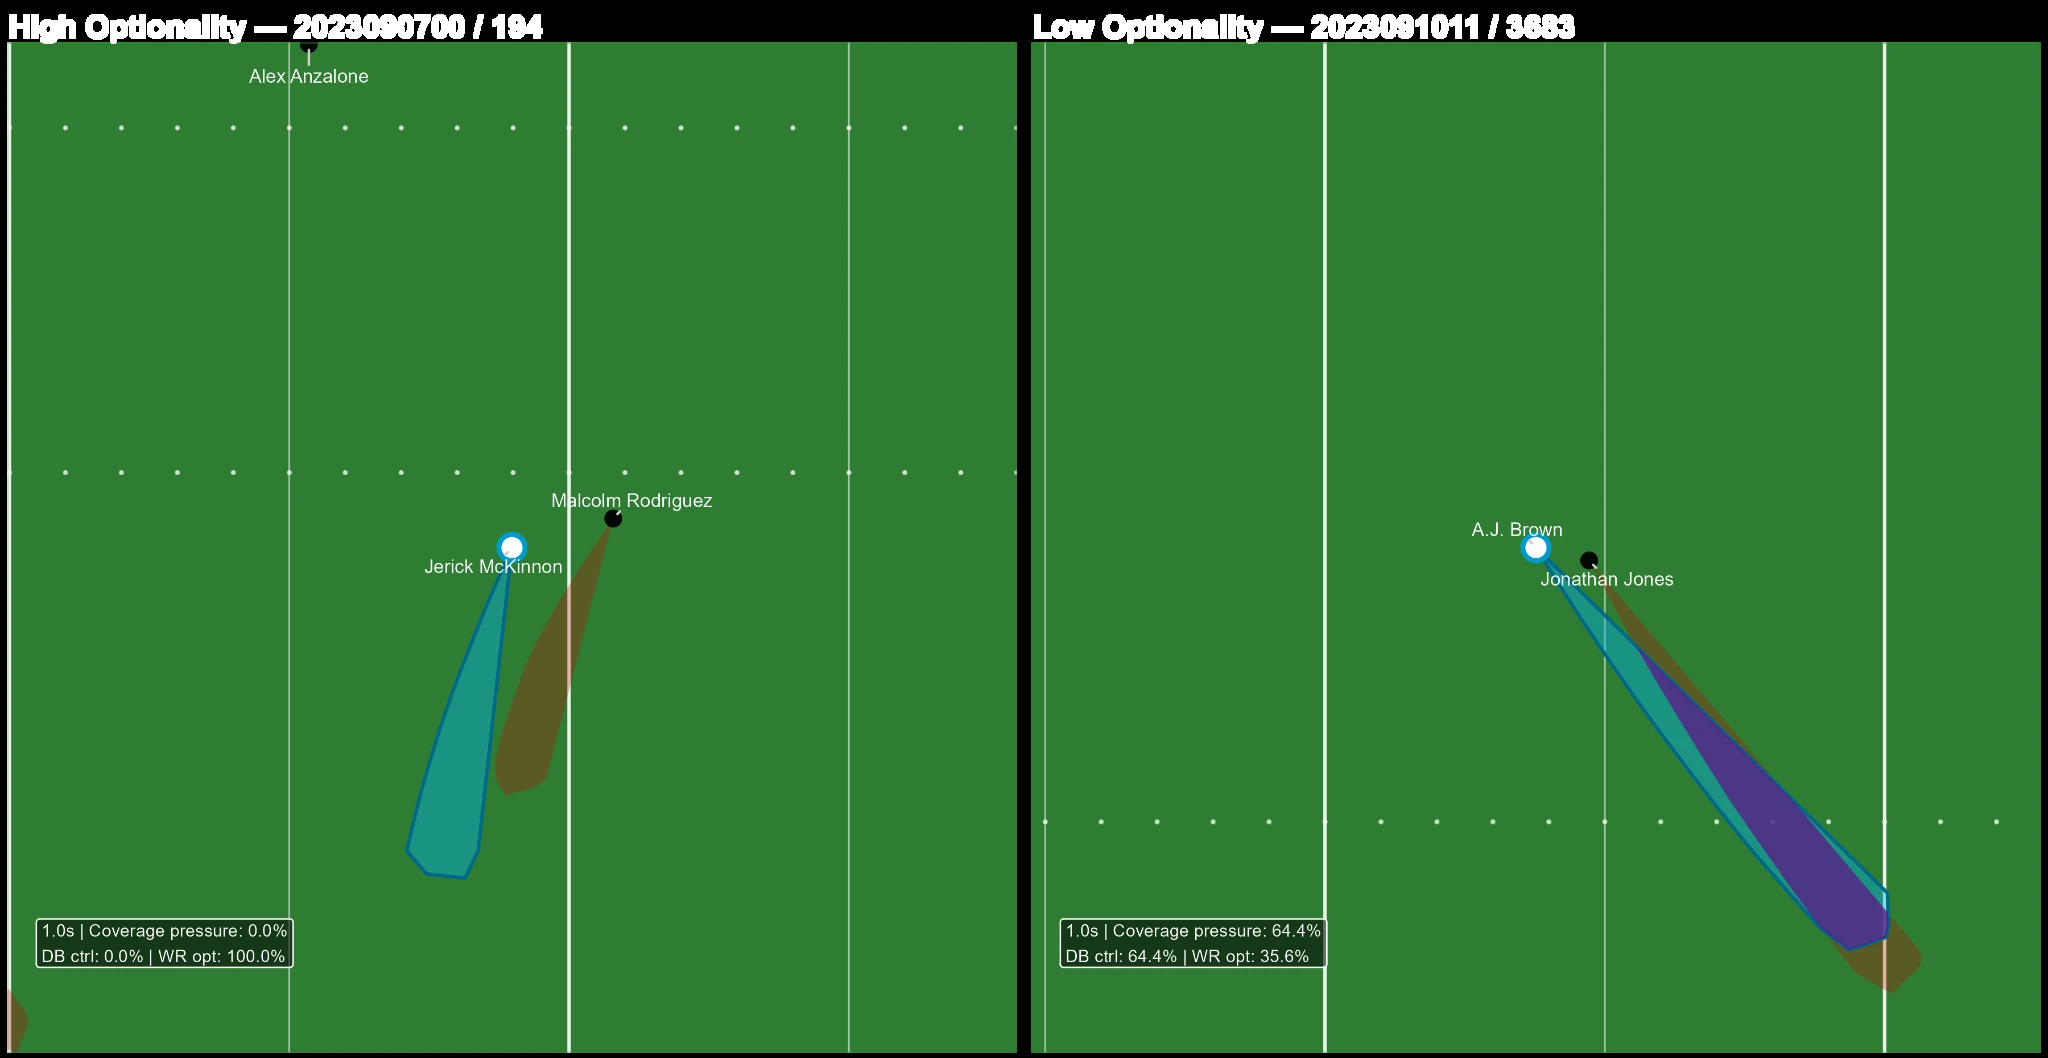
The same separation distance, two different plays. Left: the receiver keeps his space and coverage pressure is 0.0 percent. Right: the defender owns the space the receiver is running into, and coverage pressure is 64.4 percent. Figure from the paper.